

Amelia
2026.03.15.
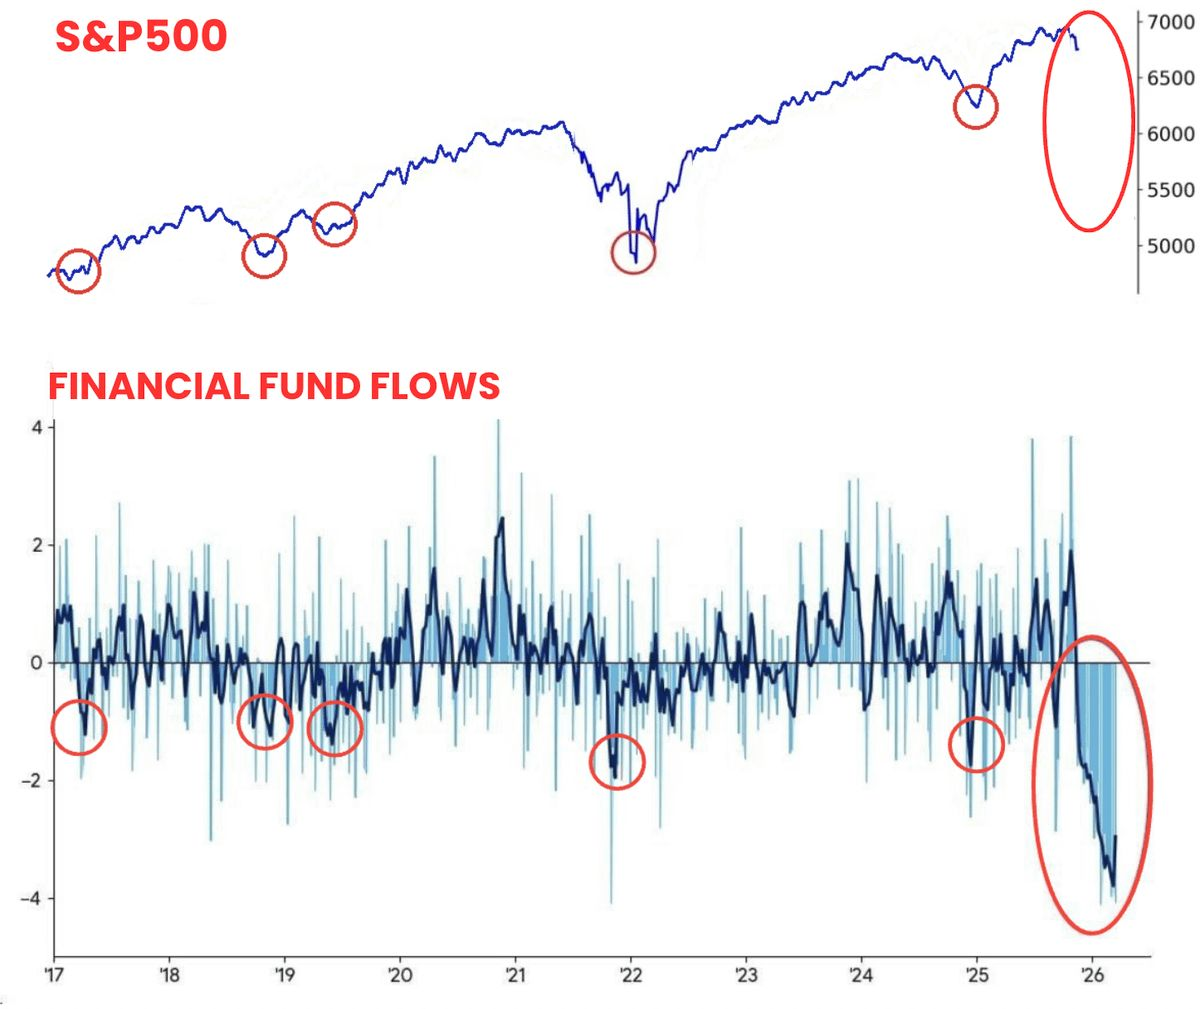
Take a close look at the latest flow data highlighted by Bank of America.
It shows record outflows from U.S. financial sector funds.
And if you think that won’t impact the assets you hold…
You’re missing the bigger picture.
Financial companies are not just another part of the market.
They are the foundation of the entire system.
Banks, brokers, lenders, and insurers provide the funding that keeps markets functioning.
When capital starts leaving this sector aggressively, it often signals stress building underneath the surface.
During the week ending March 11:
– U.S. equity funds lost about $7.77 billion
– Global financial-sector funds alone lost $2.31 billion
At the same time:
– Bond funds gained $5.72 billion
– Money market funds gained $6.93 billion
Money is moving out of stocks.
Money is moving out of financials.
Money is moving into bonds and cash.
That shift tells you something important about how investors are positioning.
If markets believed the recent geopolitical tension was temporary noise, you would normally see dip buying.
Instead, the flows suggest something different
Investors appear to be rotating defensively.
And historically, financial stocks tend to weaken before the broader market fully reacts.
According to MarketWatch, the Financial Select Sector SPDR Fund is already down roughly 13.3% from its January 6 high.
Even more interesting:
Its correlation with the S&P 500 has dropped from 0.97 to 0.74 this year.
That’s a sign the financial sector may be losing support while the broader market still appears stable.
Now consider the scale of the market.
The U.S. stock market is worth roughly $69 trillion.
That means:
– 1% move = about $690 billion
– 5% move = about $3.45 trillion
– 10% move = about $6.9 trillion
When capital begins leaving financials, the sector that provides liquidity to everything else, the potential ripple effects can become massive.
And this ties directly into the energy story.
Higher oil prices often lead to higher inflation pressure.
Higher inflation tends to push bond yields upward.
Higher yields tighten financial conditions.
And tighter financial conditions usually hit banks and lenders first.
That’s why this chart matters.
It may not simply be sector rotation.
It could be the market beginning to price stress into the system’s core funding sector.
And historically, when that sector starts weakening, the rest of the market eventually takes notice.
It’s a warning because energy markets are already pricing a larger shock, and now capital is beginning to leave the sector that usually cracks first when liquidity tightens.

15

0

공유하기
모든 댓글
아직 댓글이 없습니다.

댓글을 작성하려면 로그인하세요.