

Mr. Kim
2025.08.21.
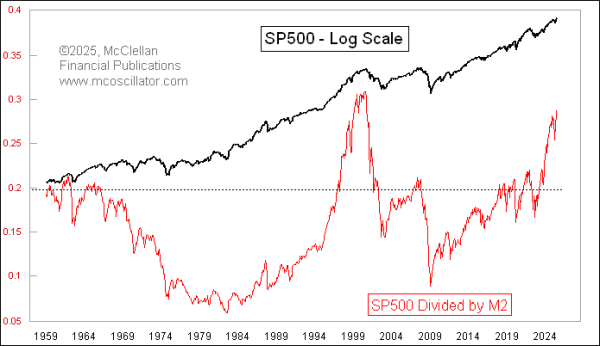
The Fed has tried to push the toothpaste back into the tube, and raw M2 saw a 5.7% drawdown as of its low point in October 2023. That was the biggest raw decrease in the history of M2, which dates back in official statistics to 1959. But the stock market has continued marching higher in spite of that drop in money supply, and so now we are seeing a fairly extreme reading for the ratio of the SP500 to M2 shown in this week's chart. It rivals the peak we saw in August 2000, at the peak of the SP500 tied to the Internet Bubble.
Seeing the SP500/M2 ratio get up above about 0.2 has been good enough to mark ordinary major stock market tops whenever it has happened since the 1959 start of the M2 data. 2000 was a rare exception of seeing it go far beyond that level. And now we are seeing that 2000 high level get challenged once again in 2025.

7

3

공유하기
모든 댓글

Keeper
2025.08.21.

다음부턴 한국말로 글을 쓰면 좋겠습니다. (Please write in Korean.)
좋아요
답글달기

푸른상상
2025.08.21.
차트보니 금융위기 이후부턴 유동성으로 올라가는 장으로 봐야겠군요.
좋아요
답글달기

월가의 현자
2025.08.22.
Based on this chart, it seems the US stock market will soon fall.
좋아요
답글달기

댓글을 작성하려면 로그인하세요.